Leaded paint and gasoline, long since retired from use in the United States, have left behind a reminder that they were once common. Their legacy is lead, a natural metal element mined from the Earth for use in many consumer products. Because it does not breakdown, most of the millions of tons of lead added to products during this century is still in the environment, contaminating soil, water, air and our bodies.
Lead-contaminated soil, found almost everywhere, can have severe health risks. Children and adults inadvertently touch, breath and eat lead-soil from inside and outside sources. Its accessability makes it a bigger lead-health threat than leaded paint and a major, if not the greatest, source of childhood lead poisoning in the United States
1.
Risk of lead poisoning varies and depends on several factors. Boys are at higher risk than girls. Poor children, who may lack proper nutrition and live near bare soils, are at higher risk than middle-class and wealthy children. Minorities face more risk than whites. Inner-city dwellers, especially the poorest and youngest, face the highest risks because of multiple exposures from lead paint, soil, air and improper nutrition. Contaminated soil and the associated health problems became well-known after an expressway in San Francisco collapsed during an earthquake. Children playing in the soil next to the broken structure were lead poisoned. The soil, in this case, tainted from decades of leaded gasoline use, contained many parts per billion (ppb) of lead. Just 10 ppb in blood is considered dangerous to children's health according gudelines from the Centers for Disease Control.
 Not all areas bear the same contamination. Lead-soil content varies between and within cities because of historical traffic congestion,city size, age of the city, industry and the type of soil. Of these, traffic, and its associated past use of leaded gasoline, plays the most important role in determining where lead is found in city and rural soils.
In general, city size, an area's location relative to the urban center and the soil's location relative to buildings and the street determine lead-soil content, according to Howard Mielke, Associate Professor of Environmental Toxicology at Xavier University of Louisiana. His insights come from 25 years of research characterizing lead dust patterns in urban areas and deciphering how home lead exposure occurs.
City size
Older, larger cities usually have more leaded soil than older, smaller cities.
Urban areas, especially the inner city corridors, experience more traffic and congestion than smaller cities and rural areas. Hence, areas with historically high traffic volume are more polluted with lead dust from leaded gasoline that settled out into the soil or clung to buildings and was washed into the surrounding soil.
| City |
Average Daily Traffic Volume |
Tons of Lead in Soil |
| Thibodaux |
10,000 |
.45 |
| New Orleans |
95,000 |
5.15 |
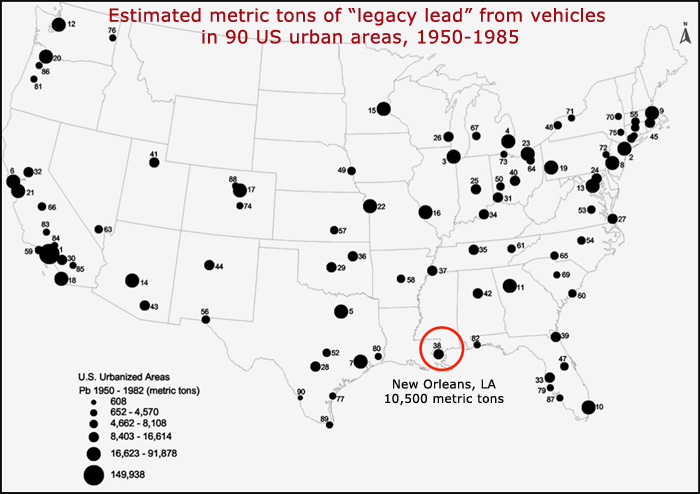
Comparing New Orleans, a large, old city, with the smaller, older city of Thibodaux, Louisiana, illustrates this. About 10,000 cars stream through Thibodaux's busiest intersections per day. In the past, they deposited about a half a ton of lead per year into the environment. New Orleans' intersections see about 95,000 cars a day, which historically deposited more than five tons of lead per year2. New Orleans' 10-fold car traffic left about 10 times the lead in the soil. Rural towns often have lower soil-lead levels, too. The median soil sample for inner city communities in New Orleans was greater than 840 parts per million (ppm) lead whereas the median soil lead for the small town of Natchitoches, Louisiana, was less than 50 ppm lead3. Since children's average blood lead levels follow the same patterns as soil-lead levels, city dwellers are at a higher risk for lead poisoning than those in smaller cities or rural areas. One study confirmed this when it found that children in rural areas had 13.9 micrograms of lead per deciliter of blood (µg/dl), those in cities with populaitons less than one million had 16.5 µg/dl, those in cities larger than one million had 18 µg/dl and those in inner cities had 20 µg/dl4.
Location relative to city center
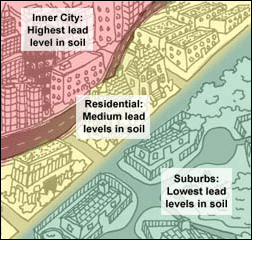
Inner city areas are more contaminated with lead than residential areas or suburbs.
Studies of New Orleans, Boston, Baltimore, Mineapolis, St. Paul, and London, England, show that inner city areas have more lead pollution than outlying areas. Streetside samples in New Orleans' inner city areas range from 600 to 1,200 micrograms of lead per gram of soil (µg/g) while soils in suburban areas contain less than 75 µg/g5 (see illustration below). Soil lead levels in city areas of Mineapolis and St. Paul ranged from 100 ug/g to more than 1,200 ug/g while outer lying suburbs ranged from 30 to 100 ug/g, a 100-fold change between the two areas5,6. Why the differences? In general, inner cities:
- have historically high traffic flow and congestion,
- may have more bare or exposed soil,
- contain more leaded paint on houses and buildings, and
- concentrate and retain hot air and pollutants.
These higher inner-city soil-lead levels mean that city children face a greater health threat than their suburban counterparts. Many of these children may be getting more than the maximum daily lead intake of 150 µg. In Mineapolis, where 78 percent of homes had soil-lead levels higher than 500 µg/g, a child eating just a half a gram of soil would ingest 250 µg of lead, almost twice the suggested maximum daily intake. Soil control measures and education are important deterrents. Some Public Housing complexes in inner city New Orleans have surprisingly low lead levels in surface soil because sand is routinely spread on the property to raise ground levels. Other simpler soil and dust control measures - keeping soil dust low, covering bare soil, keeping hands and toys clean - also significantly reduce lead exposure and blood lead levels.
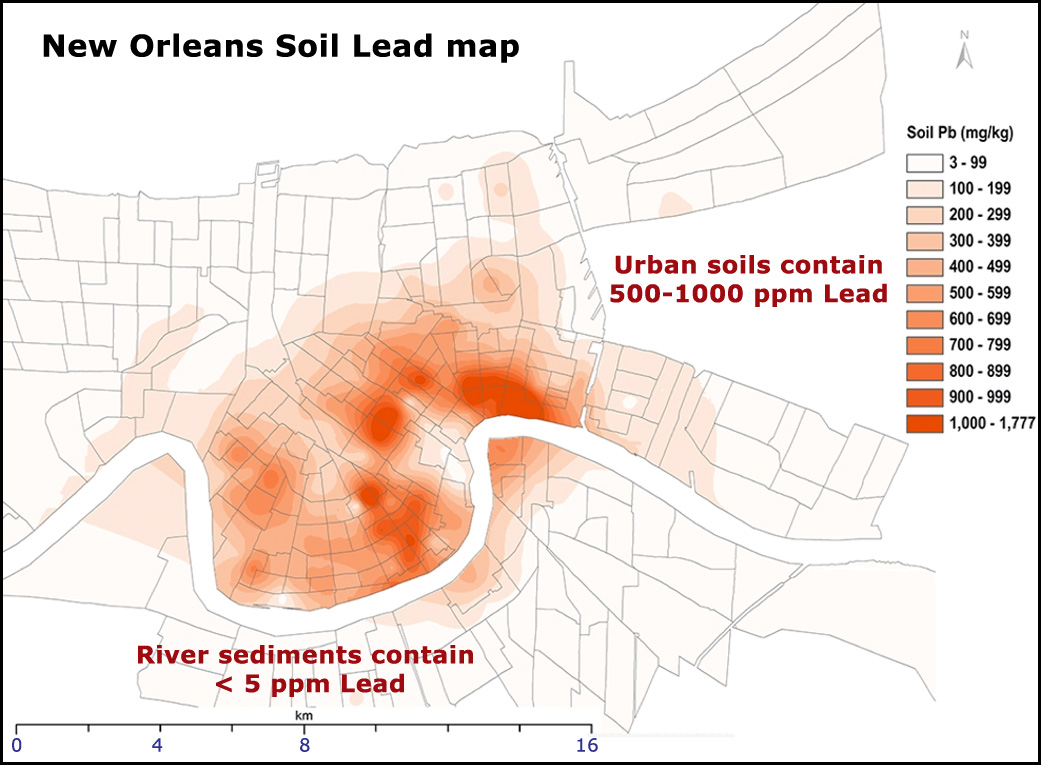
Computer images of lead soil in the New Orleans metro area.
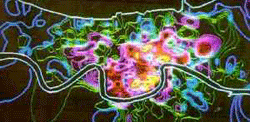
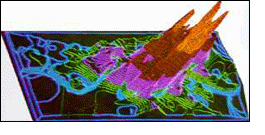
Soil lead levels are highest near the inner city (yellow contours) and decrease (red, pink, green, blue) with increasing distance from the city center. The 3,074 surface soil samples representing all 283 census tracts were collected from residential properties one meter from buildings and streets and in midyard areas but not near busy traffic streets and corners. Map colors designate the amount of lead from soil residents may be exposed to on a daily basis.
| Color |
Soil lead, Parts per million (ppm) |
| Yellow |
600 - 1,200 |
| Red |
300 - 600 |
| Pink |
150 - 300 |
| Green |
75-150 |
| Blue |
less than 75 |
Soil's location relative to buildings and the street
Soil near building foundations and next to the street have higher lead content than soils in the middle of yards or playgrounds.
Median lead soil content (ug/g)
New Orleans metro area |
| |
Houseside |
Midyard |
Streetside |
| Inner city |
840 |
212 |
342 |
| Midcity |
110 |
40 |
110 |
| Suburbs |
86 |
28 |
50 |
The amount of lead in streetside, midyard and houseside soil generally follows these trends:
- The highest soil-lead levels are found near buildings in inner-city neighborhoods. Two factors are responsible for this trend:
- small, airborne lead-dust particles from leaded gasoline and industry that collected on buildings and were washed into surrounding soils (especially in high traffic areas) and
-
lead-paint chips, dust and debris from buildings that settled out into houseside soil.
Median soil content near buildings in Minnesota's Twin Cities range from 100 ppm in outlying areas to 800 ppm in the inner city areas. The highest levels were next to inner city houses near historically congested trafficways7. Leaded paint also contributes to the problem as soil next to painted buildings had twice the soil-lead content as soil next to brick, stucco and stone buildings. Even so, soil near the mostly unpainted brick structures of Baltimore's inner city had similarly high lead-soil levels suggesting that lead from exhaust plays as large a role in soil-lead levels next to buildings as leaded paint8.
- Houseside and streetside lead-soil levels are higher in the inner city than in outlying areas, are highest near heavy traffic areas and are higher than midyard areas:
The numbers tell the story. The median lead-soil level of 840 ppm (ranges from 400 to 2,500 ppm) near buildings in New Orleans' inner city are almost eight times higher than the midcity lead-soil medians of 110 and almost 10 times higher than 86 ppm found near buildings in the suburbs5. Streetside soil of the inner-city are also more contaminated than those in midcity and the suburbs. Even more so than houseside soils, lead in soil near streets is directly related to the amount of past daily traffic. The more historic traffic, the more lead that, most likely, settled out into the soil from leaded gasoline. In all locations, midyard soil contains the lowest amount of lead.
- The lowest soil-lead levels are found near buildings in the suburbs:
Unleaded paint usually covers these younger buildings minimizing leaded paint residue in soils. Auto emissions probably contribute the lion's share of soil lead since suburban streetside soil is more contaminated than the soil next to suburban houses. City size also influences the amount of lead found in different parts of the yard. Like the suburbs, streetside samples in small towns were more contaminated than houseside samples. Median soil-lead levels in Minnesota's small cities had slightly higher soil-lead levels near the street than near foundations while large cities had three times the amount of lead in soil near buildings than streetside.